Output Tab
This section introduces each feature of the Output Tab. The Tunny Output screen was designed with inspiration from Wallacei.
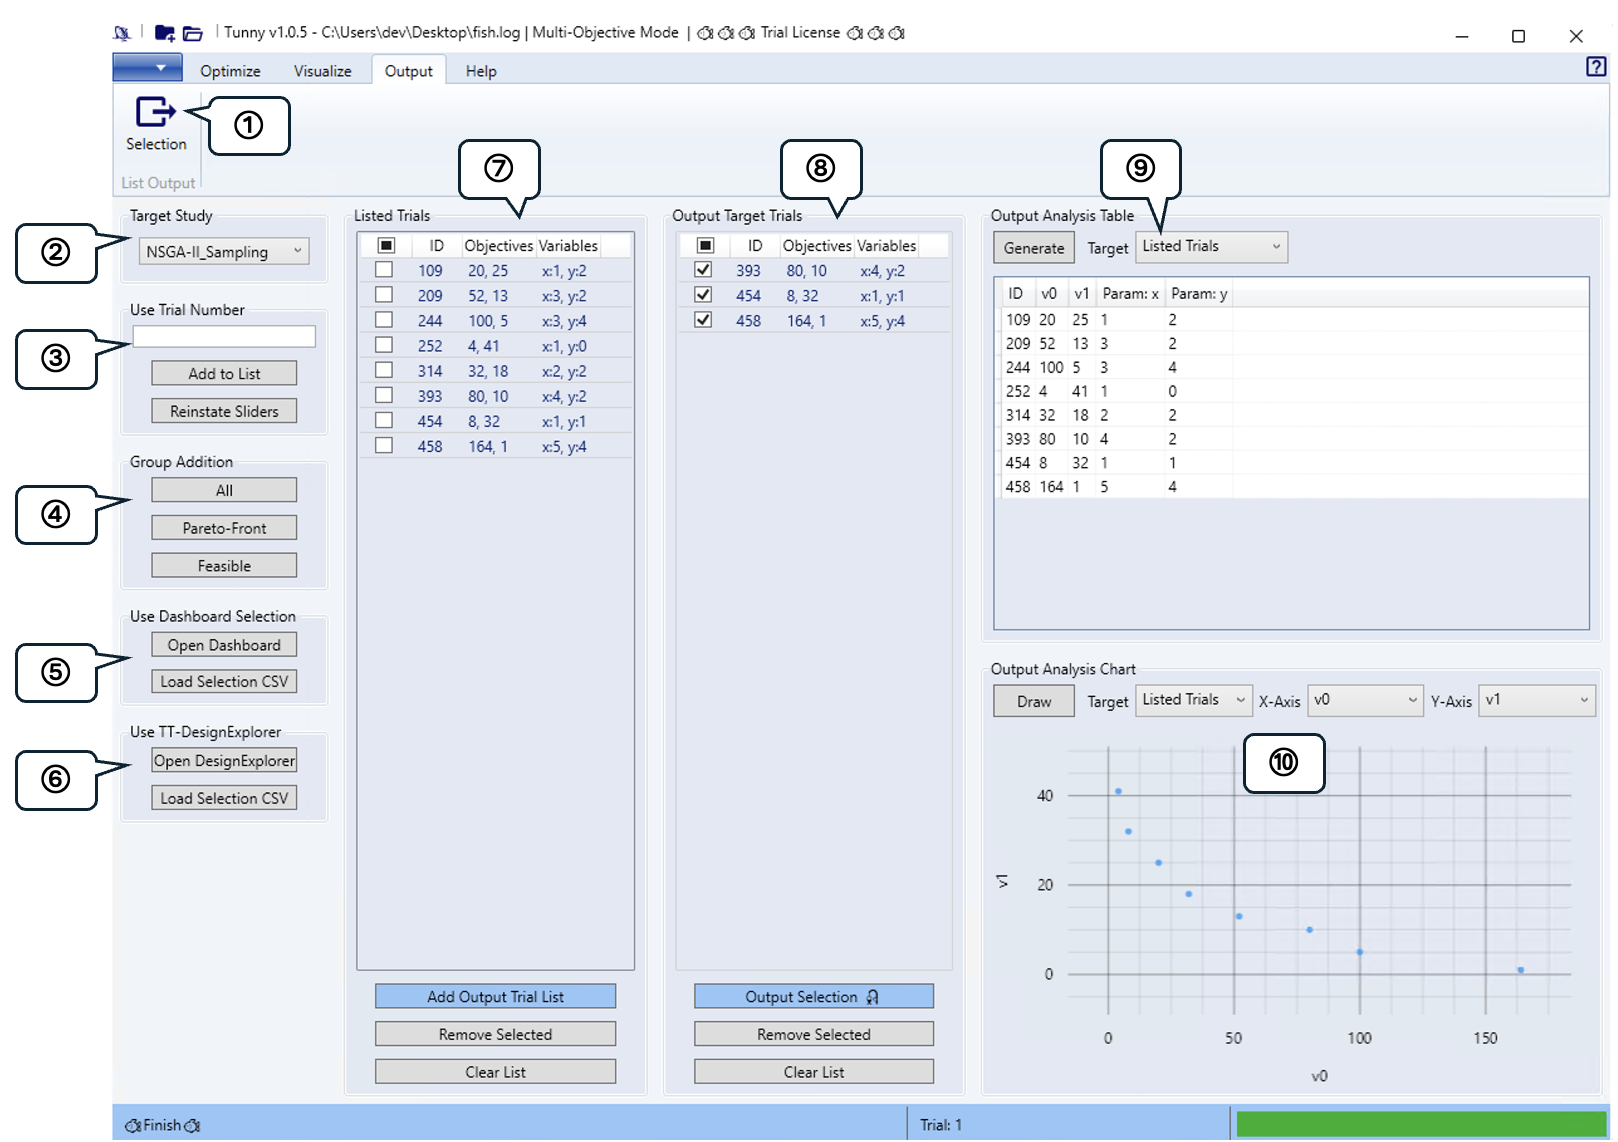
① List Output - Selection
There is only one output mode. A screen will appear allowing you to select the output based on user choice.
② Target Study
Select the name of the Study to output.
③ Use Trial Number
In this group, output settings are configured by directly entering the Trial Number.
After entering numbers, clicking Add to List will add them to the right-hand
list, making them available as output options. Clicking Reinstate Sliders will
apply the entered numbers as trial values in Grasshopper's sliders.
④ Group Addition
This button group allows you to add specific groups to the output candidate list:
Alladds all groups.Pareto Frontadds individuals from the Pareto front.Feasibleadds solutions that are feasible under all constraints.
⑤ Use Dashboard Selection
This button group allows you to select which trials to output when using Optuna Dashboard.
Open Dashboardlaunches the Optuna Dashboard.Load Selection CSVis used to import the CSV file containing selected trials exported from Optuna Dashboard.
⑥ Use TT-DesignExplorer
This button group allows you to select which trials to output when using TT-DesignExplorer.
Open DesignExplorerlaunches the TT-DesignExplorer.Load Selection CSVis used to import the CSV file containing selected trials exported from TT-DesignExplorer.
⑦ Listed Trials
The candidate solutions will be displayed here. You can verify both the objective function values and variable values for items added to the list.
The checked items on the left will become the target for the buttons at the bottom of the table:
Add Output Trial Listwill add checked individuals to the right-side output trial list.Remove Selectionwill remove checked individuals from the list.Clear Listwill remove all trials from the list.
⑧ Output Target Trials
The operation method is similar to that of Listed Trials.
When you check the box and press Output Selection, the selected trials will be
output as the Fishes output in the Grasshopper Tunny component.
⑨ Output Analysis Table
This table is used for analyzing the trials added to your list.
Select your target list and click Generate to display the trials in that list.
This table is compatible with Excel — you can copy this table and paste it
directly into Excel.
These features will be particularly useful when processing results in Excel.
⑩ Output Analysis Chart
You can create charts to analyze trials added to your list.
By selecting the target list and the values to display on the axes, then
pressing Draw, you can create a chart of its contents.
How to Select Trials in Optuna Dashboard
While still experimental, you can now select which trials to output through the Optuna Dashboard. First, enable the experimental feature display as follows:
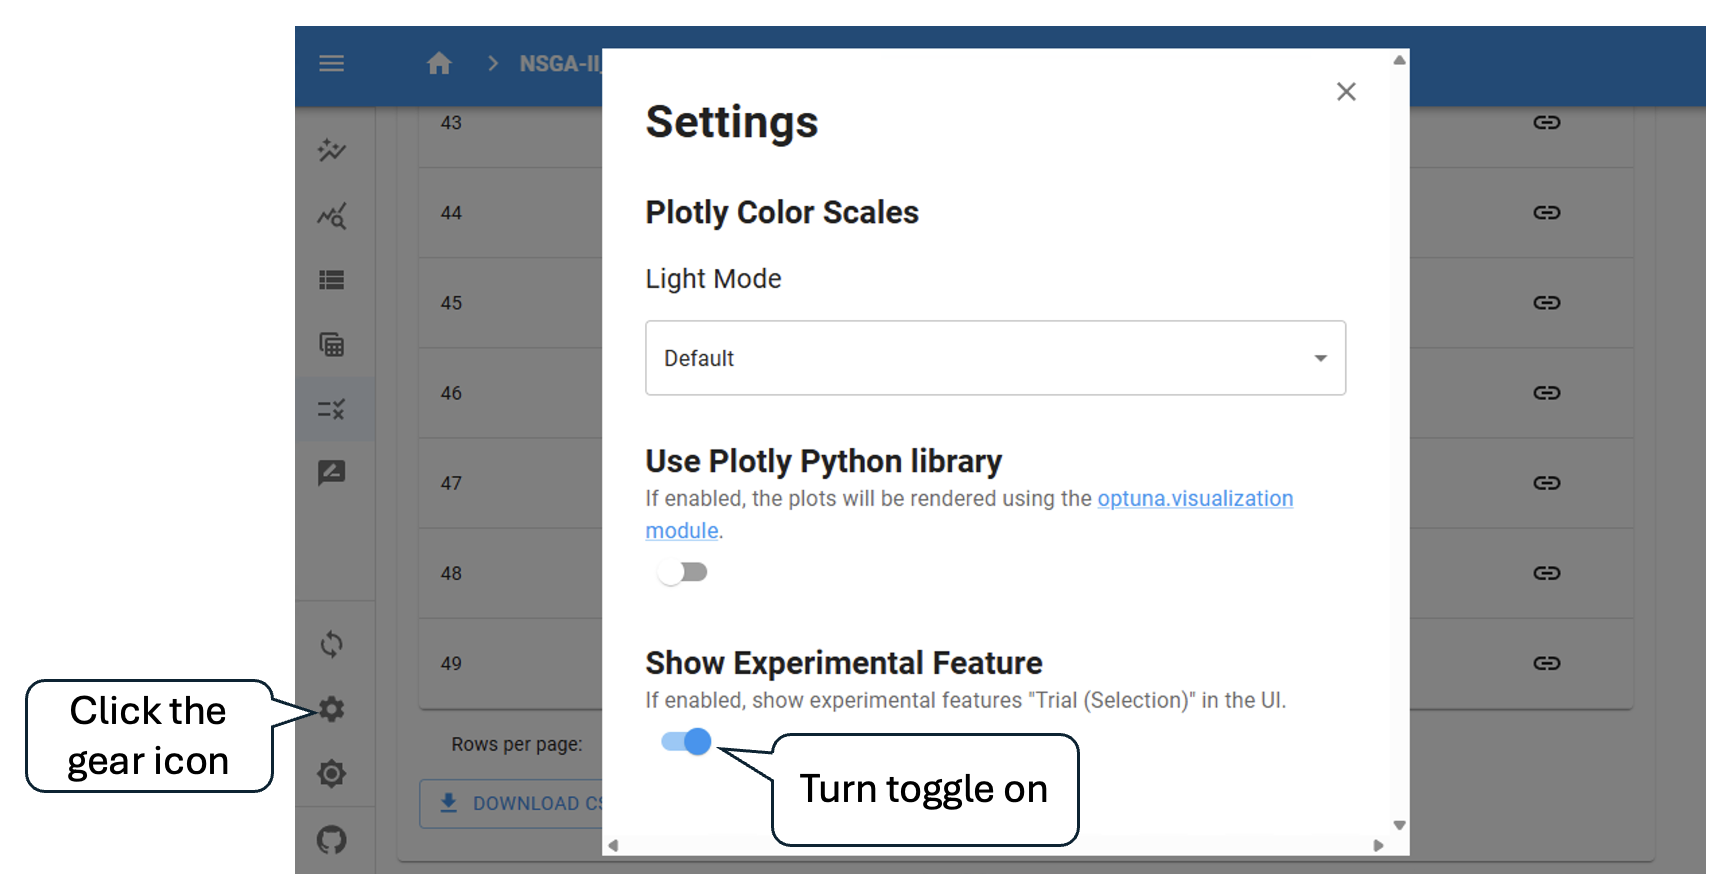
Use the Trials (Selection) interface that appears to make selections. On the Trials Selection page, you'll see a Parallel Coordinate plot. Selecting any part of this graph will dynamically update the Pareto front plot below. Trials marked with color are the selected ones.
Below the plot, you'll find a table listing all selected trials. At the bottom
of the table, you'll see a Download CSV File button - clicking this will
export the selected trials.
You can then load this generated CSV file into Tunny to import the selected trials into its user interface.