Widgets
This chapter gives an overview of the charts and panels Tunny Dashboard provides.
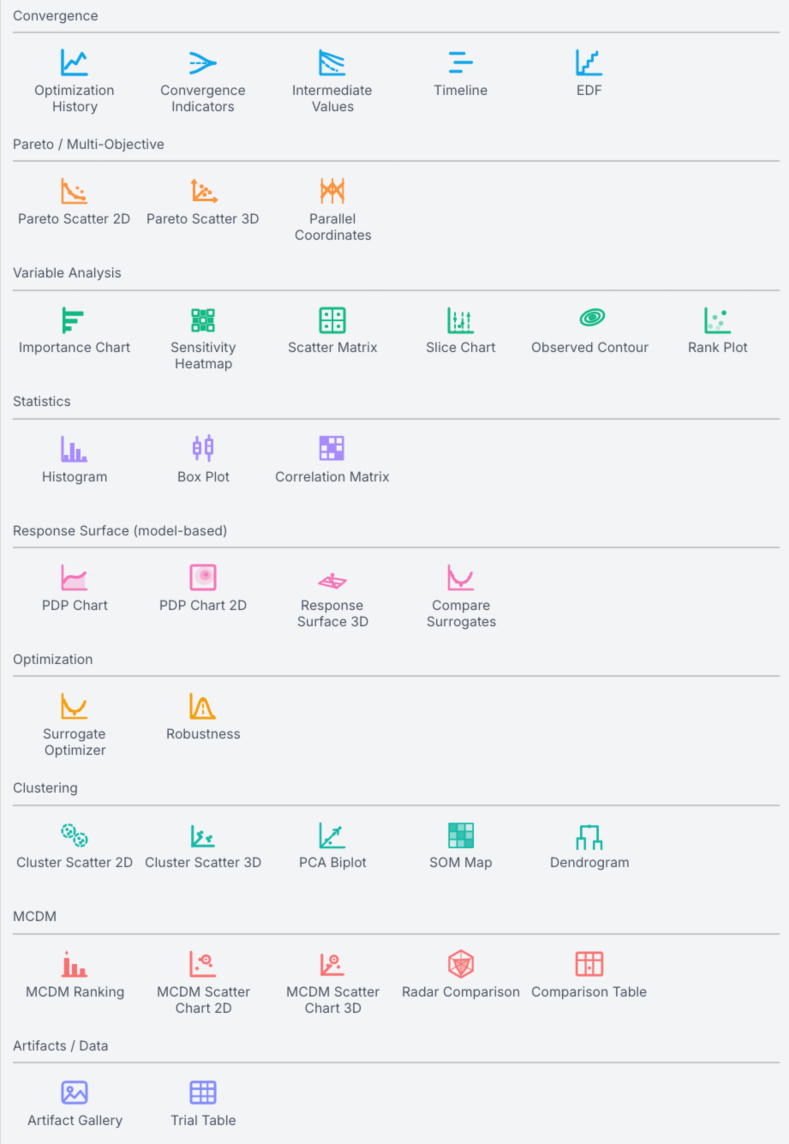
Each widget used for analysis can be selected from the Widgets panel, which appears when you hover the mouse over the right edge of the UI canvas.
The layout follows the app's Widgets screen, using the same classifications and names. For widgets whose theory is explained in another category, the page here is a short summary that links to that category.
All charts share a common set of mouse controls (pan, zoom, rotate, and selection). These are documented in Chart Controls. Each widget page below covers only what is specific to that widget.